The Evolution of Soil Analysis: From Composite Sampling to Field-Scale Intelligence
How continuous, calibrated soil scanning is shifting nutrient management from field averages to zone-level decision intelligence.

For decades, soil analysis has followed a simple logic: take samples, send them to a lab, average the results, and fertilize accordingly.
That approach made sense when farms were smaller, input costs were more stable, and variable-rate application was not yet widely available. But modern large-scale agriculture operates under very different conditions:
- Input price volatility
- High fertilizer costs
- Increasing weather variability
- Greater pressure on margins
- Precision application systems already in place
The question is no longer:
“What is the average nutrient level of this field?”
The more important question is:
Where exactly are the constraints within the field, and what is their economic impact?
That shift marks the evolution from sampling to field-scale soil intelligence.
The Structural Limitation of Composite and Grid Sampling

Traditional soil sampling generally follows one of two models:
Composite sampling: several cores combined into a single result for the field
Grid sampling: structured sampling points, often at 1-3 hectare resolution
Both methods share the same fundamental limitation:
They measure points, not spatial continuity.
A 60-hectare field sampled on a 2-hectare grid may produce 30 data points. But the same field contains millions of spatial variations in:
- Texture
- Mineral composition
- Organic matter
- pH
- Moisture retention
- Nutrient holding capacity
The result is that interpolation between sparse data points often creates smooth maps that fail to reflect the true variability of the soil.
This becomes economically significant when fertilizer is applied uniformly based on averaged values.

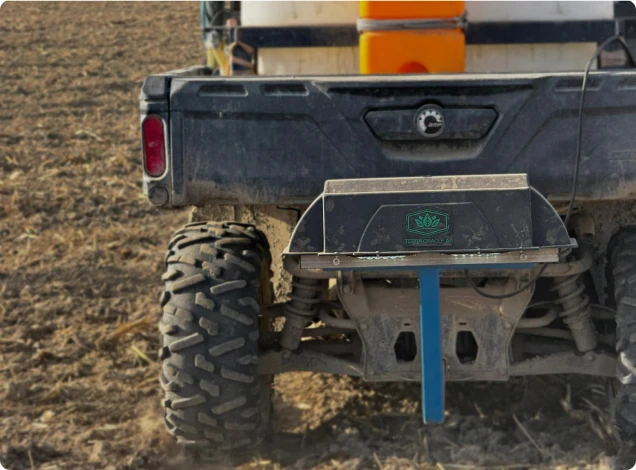
What Continuous Gamma-Based Soil Scanning Changes
Gamma-based soil scanning measures naturally occurring gamma radiation emitted by soil minerals. These signals correlate strongly with:
- Clay content
- Mineralogy
- Cation exchange capacity
- Potassium-bearing minerals
- Textural variability
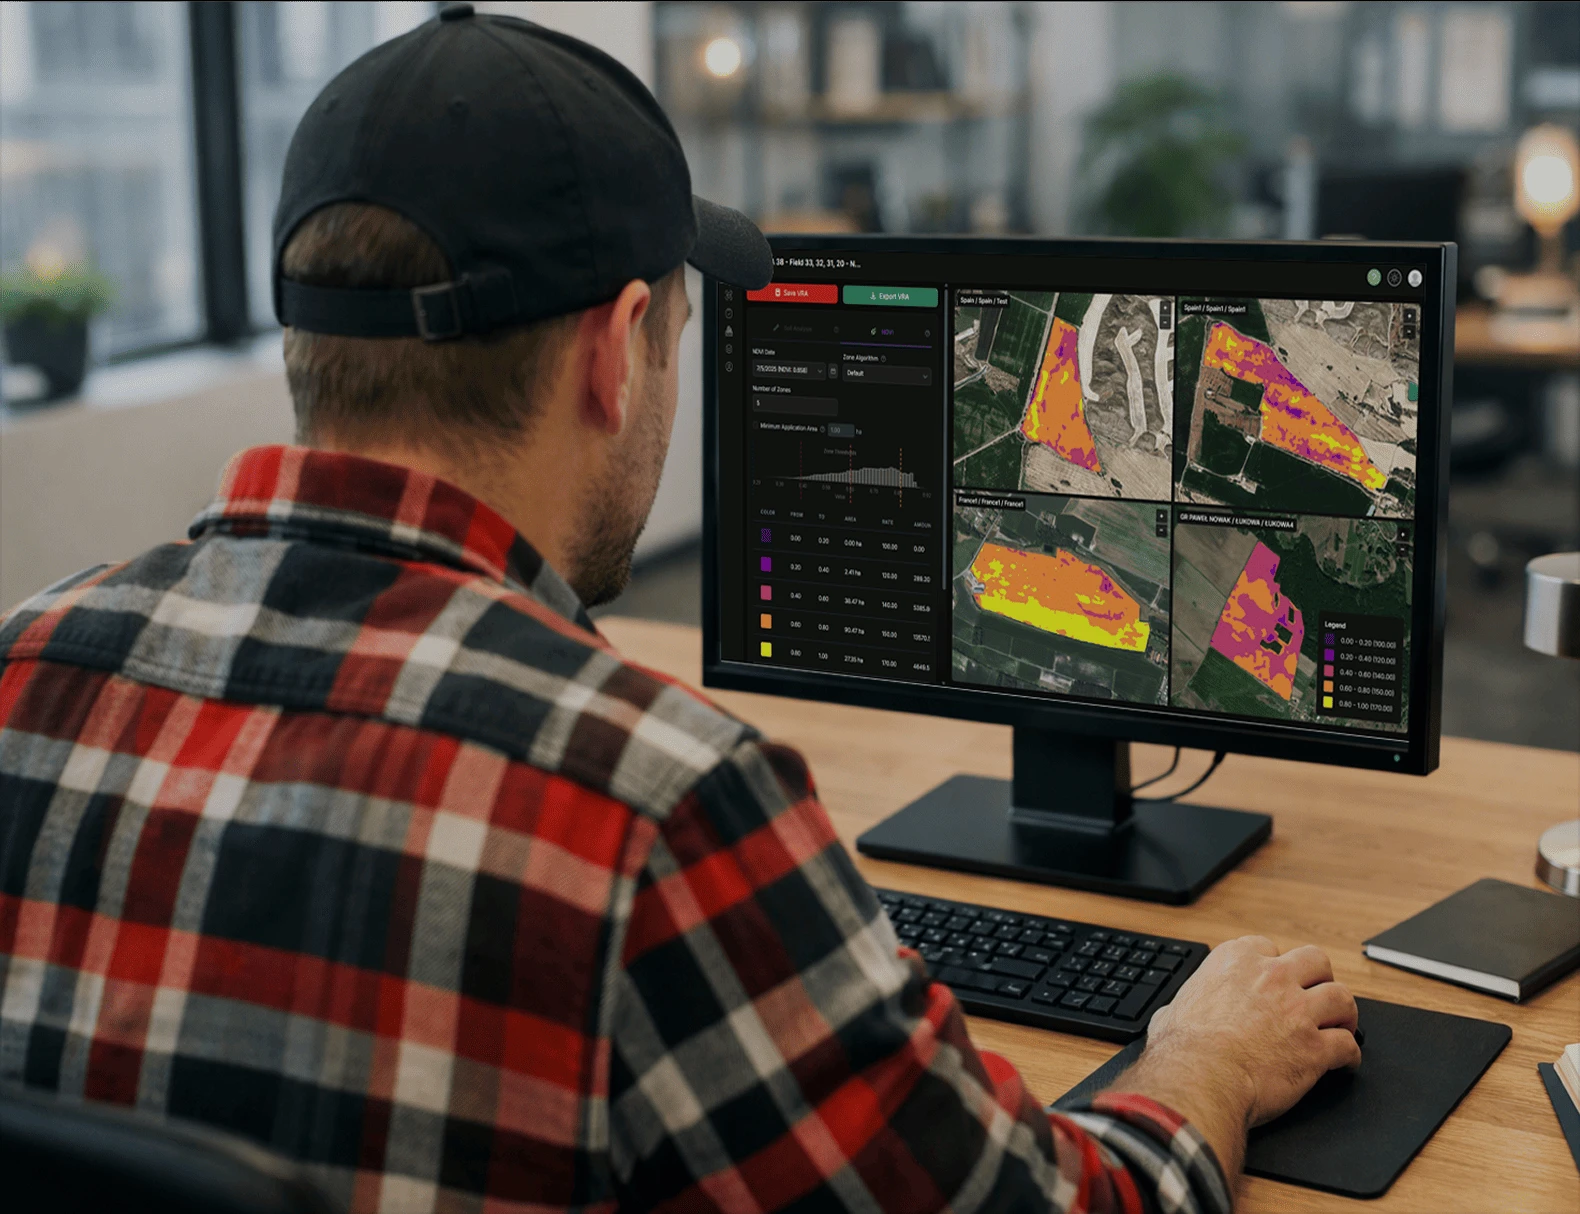
When scanning data is calibrated with laboratory samples, the system moves beyond raw sensing and becomes a validated model for nutrient prediction and soil-zone definition.
Instead of 30 data points in a 60-hectare field, growers gain thousands of continuous measurements per hectare, creating a far more accurate picture of field variability.
This is not simply a matter of having more data.
It is a fundamentally different level of agronomic understanding.
Field Example 1: Phosphorus Lock-Up in a Uniformly Fertilized Field
A 180-hectare wheat operation in Central Europe had relied on 2-hectare grid sampling for years. Laboratory results suggested moderate phosphorus levels across the field, and uniform P application remained standard practice.
Yet yield variability persisted, with differences of up to 18% between zones.
After transitioning to calibrated gamma-based zonal scanning, a different picture emerged:
- Clay-dominant zones with high phosphorus fixation
- Sandy strips with lower phosphorus retention
- Localized areas with excessive legacy phosphorus accumulation
This changed the management strategy:
- Reduced phosphorus application in high-reserve zones
- Increased targeted application in deficient areas
- Adjusted lime strategy in fixation-prone zones
After two seasons, the operation recorded:
- 12% reduction in total phosphorus input
- 7% average yield increase in historically underperforming zones
- Improved yield consistency across the field
The original grid sampling had not captured the mineralogical variability driving nutrient behavior.
Field Example 2: pH Variability and Lime Misallocation
A large maize producer managing 900+ hectares had historically applied lime uniformly based on composite sampling.
Composite averages suggested a pH of 6.2, which appeared acceptable at field level.
Gamma-calibrated zonal scanning revealed:
- 22% of the field was below pH 5.5
- 31% was already above the optimal range
- Acidic zones showed a strong correlation with yield depression
Instead of continuing blanket lime applications, the grower implemented variable-rate liming.
Over two crop cycles, the outcome was clear:
- Acidic pockets were corrected
- Lime over-application was reduced
- Nitrogen efficiency improved in corrected zones
- Protein consistency became more stable
Uniform sampling had masked micro-environments with clear economic consequences.
Field Example 3: Fertilizer Savings Through Textural Zoning
In a high-input oilseed rape operation, nitrogen recommendations had been based on average organic matter values derived from grid sampling.
Gamma-derived zonal mapping revealed:
- High-clay zones with stronger nutrient retention
- Lighter soils with faster nitrogen leaching
- Distinct differences in moisture-retention behavior
By linking soil texture zones with AI-driven nutrient modeling:
- Reduced nitrogen rates in retention zones
- Optimized split applications in lighter soils
- Reduced total nitrogen use by 9% without yield penalty
The value was not only lower input cost. It was also lower risk in an environment of volatile fertilizer pricing.
Why Resolution Changes Economics
The economic impact of moving from point sampling to continuous zonal intelligence can be summarized in three structural improvements:
1. Reduced Over-Application
High-reserve areas are no longer fertilized “just in case.”
2. Targeted Deficiency Correction
Yield-limiting zones receive focused intervention instead of being diluted by field averages.
3. Improved Input Efficiency
Fertilizer, lime, and irrigation strategies can be aligned with real soil behavior rather than broad assumptions.
The outcome is not just agronomic optimization.
It is margin optimization.
The Strategic Shift: Soil as a Spatial System
The most important conceptual shift is this:
Soil should no longer be treated as a static average across the field.
It should be managed as a dynamic spatial system, where:
- Mineralogy influences nutrient behavior
- Texture affects retention and movement
- pH shapes nutrient availability
- Economics determines the optimal level of intervention
Continuous zonal scanning, calibrated with laboratory validation and interpreted through AI-based agronomic models, turns soil data into practical decision infrastructure.
From Data Collection to Soil Intelligence
The evolution of soil analysis is not about replacing laboratories.
It is about scaling insight across the field.
Composite sampling answered one question:
“What is the average condition of this field?”
Field-scale intelligence answers a more useful one:
“Where are the constraints, what is their economic impact, and how should we respond?”
That distinction defines modern precision agronomy.
And increasingly, it defines competitive advantage in large-scale agriculture.